


EUR/NZD is fast approaching a key inflection point after a sharp downswing!
Think the bears are just waiting for an opportunity to pounce?
Let’s take a closer look at the 4-hour time frame:
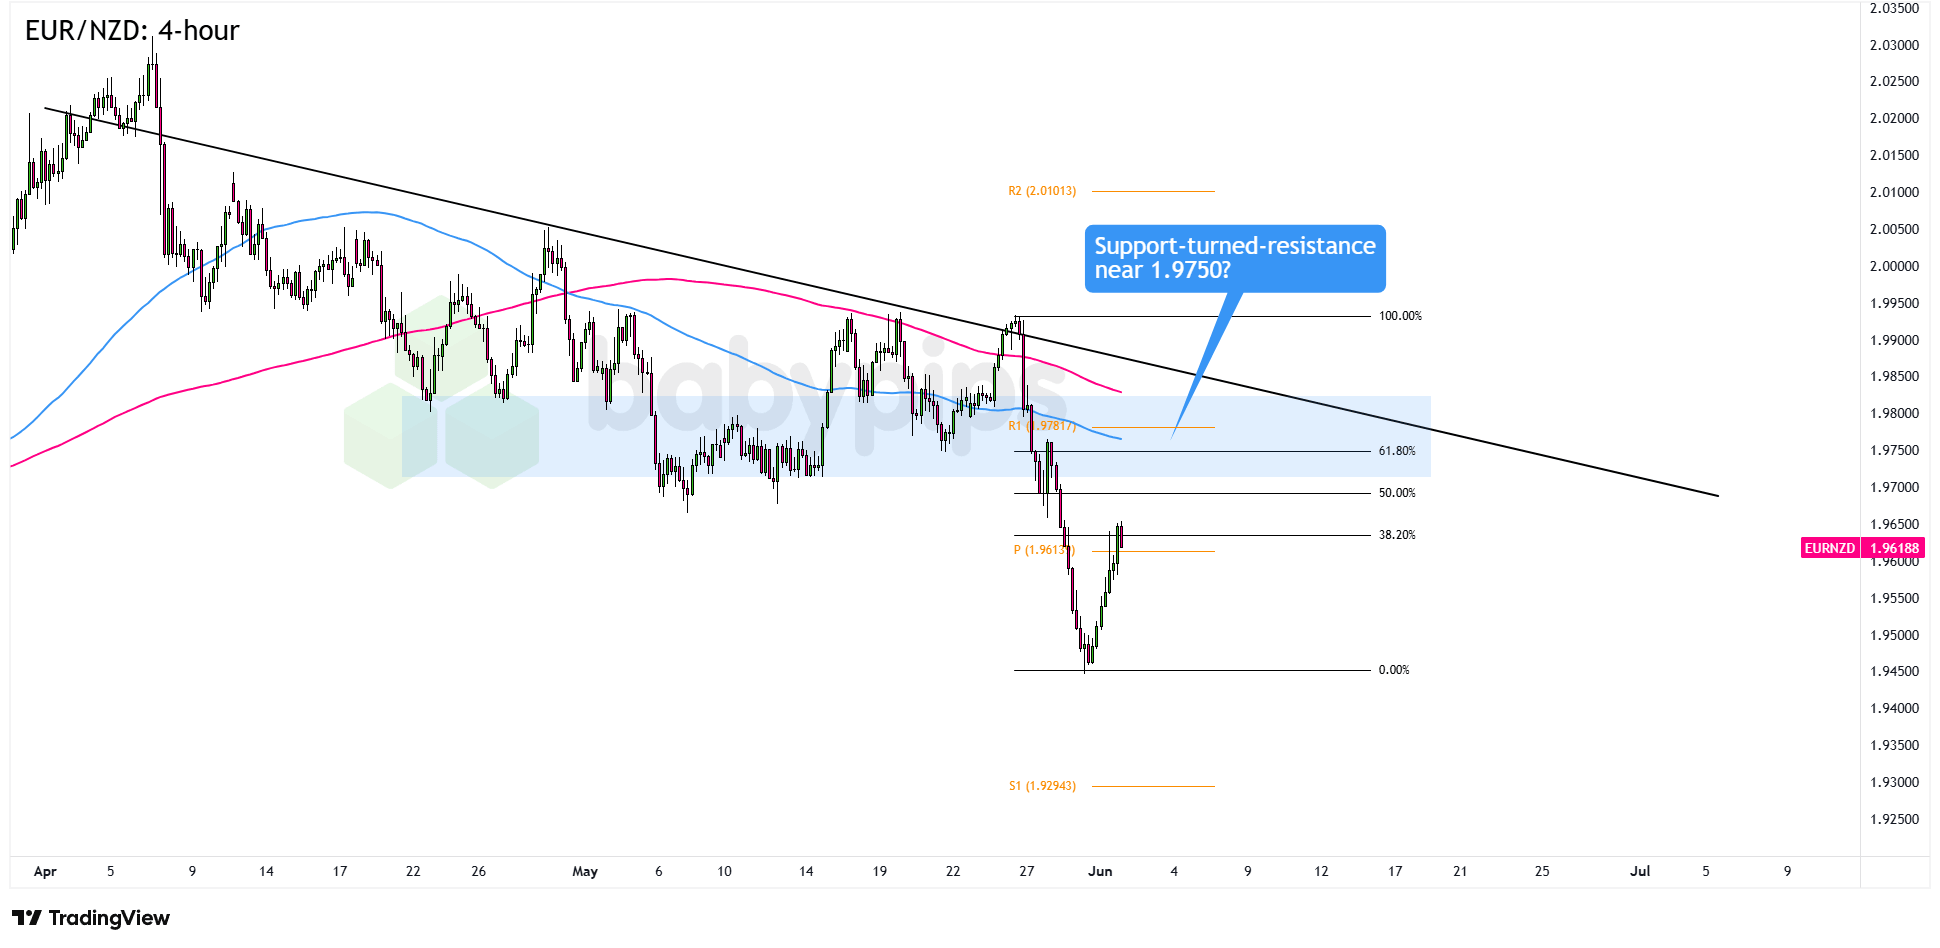
EUR/NZD: 4-hour
EUR/NZD 4-hour Forex Chart Faster with TradingView
EUR/NZD dropped sharply last week after the RBNZ’s “hawkish hold” decision raised the odds of a near-term rate hike from New Zealand’s central bank.
But the euro is not exactly sitting in the corner eating crayons. ECB officials have also been hinting at possible tightening if global crude oil markets, and therefore inflation risks, do not cool soon.
With euro area services PMIs due throughout the week, traders will be watching to see whether the numbers confirm the region’s uneven recovery or give ECB hawks more reason to keep talking tough.
EUR/NZD plunged to the 1.9450 zone after last week’s RBNZ-driven selloff, then clawed its way back toward 1.9600 as buyers tried to stabilize the pair.Remember that directional biases and volatility conditions in market price are typically driven by fundamentals. If you haven’t yet done your homework on the New Zealand dollar and the euro, then it’s time to check out the economic calendar and stay updated on daily fundamental news!
The problem for bulls is that the former support zone now lines up with the 61.8% Fibonacci retracement, the 100 SMA, and trend line resistance on the 4-hour chart. Looks like EUR/NZD is running into a pretty crowded ceiling!
Bearish candlesticks or a clear rejection from 1.9750 could open the door to another drop toward the 1.9450 lows, if not fresh swing lows.
On the other hand, sustained trade above 1.9600 and then 1.9750 could bring in enough buyers to target an upside breakout above 1.9900.
Whichever bias you end up trading, don’t forget to practice proper risk management and stay aware of top-tier catalysts that could influence overall market sentiment.
Please be aware that the technical analysis content provided herein is for informational and educational purposes only. It should not be construed as trading advice or a suggestion of any specific directional bias. Technical analysis is just one aspect of a comprehensive trading strategy. The technical setups discussed are intended to highlight potential areas of interest that other traders may be observing. Ultimately, all trading decisions, risk management strategies, and their resulting outcomes are the sole responsibility of each individual trader. Please trade responsibly.
EUR/NZD is running into a level where Fibonacci, a moving average, and trendline resistance all line up at once, and if you’re not familiar with how to read that kind of setup, Premium members can read our lesson:
📖 Confluence: Stacking the Odds in Your Favor
Reading this helps you understand why overlapping technical signals carry more weight than a single indicator, how to score a setup before you take it, and how to tell the difference between a high-conviction level and one that just looks that way on the chart.
And if you’re not a Premium subscriber yet, now’s a good time to sign up.
With Babypips Premium, you get full access to School of Pipsology lessons that help you understand not just where price is stalling, but why multiple signals converging at the same level changes the weight of a setup.


