


AUD/NZD is starting the week with a noticeable push higher, with momentum beginning to turn in its favor.
After a choppy stretch where rallies repeatedly struggled to extend, today’s move stands out for both size and location on the chart.
The MACD has now delivered a classic “momentum turning” event that many trend-followers monitor closely.
The next few candles may help clarify whether this is a durable change in tone or another short-lived pop.
Welcome to “TA Alert of the Day.” Each day after the market close, MarketMilk scans for popular technical indicator alerts. We use these alerts as the basis for a mini-lesson, breaking down what each alert means, why it matters, and how traders might interpret it. The goal is to help beginner traders not only spot these alerts but also understand the logic behind them and how they can inform trading decisions.
What MarketMilk Has Detected
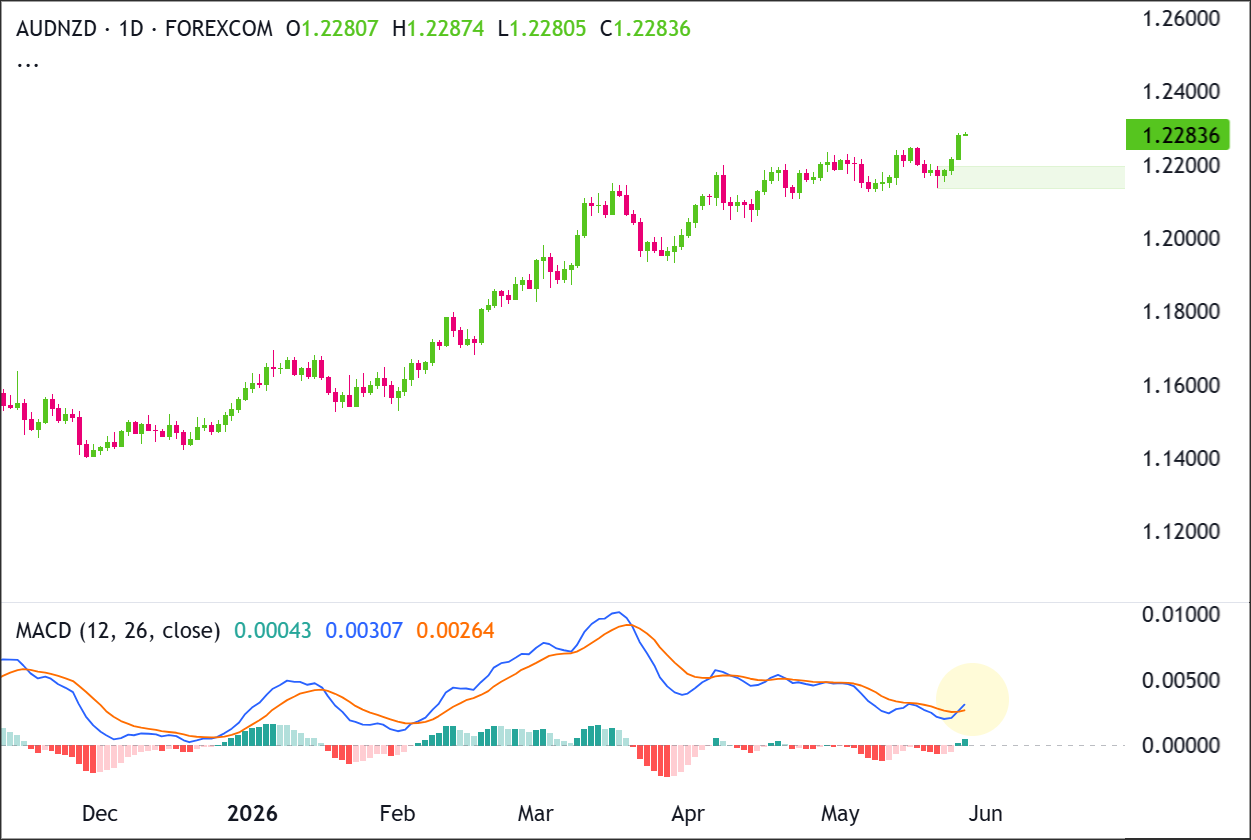
MarketMilk detected a bullish MACD(12,26,9) crossover on the Daily (1d) timeframe, with the MACD line moving above the signal line on the latest close.
AUD/NZD remains in a clear daily uptrend, with price making higher highs and higher lows from the December base into the current push near 1.22836.
The main support zone sits around 1.2130-1.2190, which has recently acted as a consolidation floor and launch area.
The nearest breakout area is 1.2280-1.2300, while the next visible upside target is the round-number resistance area near 1.2400.
What This Signals
Traditionally, a MACD line crossing above its signal line suggests that upside momentum is improving and can attract trend-following traders, particularly if it occurs alongside a clean break above nearby resistance.
If the move is sustained, traders often treat the crossover as a sign that the prior pullback may be transitioning into a renewed advance rather than continuing to fade.
However, this same pattern can also represent a late or fragile turn when it occurs inside a broader sideways market.
In those conditions, MACD crossovers can cluster and sometimes coincide with whipsaws, where prices briefly lift into resistance (such as the 1.228–1.233 area) and then roll back into the prior range.
Alternatively, the crossover may be signaling less about the trend and more about a short-term relief move after the mid-May dip.
If AUD/NZD cannot hold above recently reclaimed levels (for example, the prior congestion around 1.220–1.222), the bullish crossover can fail quickly and revert to neutral momentum.
The outcome depends heavily on follow-through price action, the broader trend structure, and where the crossover occurs relative to well-defined support/resistance.
How It Works
The MACD (Moving Average Convergence Divergence) is built from the relationship between two exponential moving averages (commonly 12- and 26-period EMAs).
The MACD line measures the distance between those EMAs, while the signal line is typically a 9-period EMA of the MACD line.
When the MACD line crosses above the signal line, it reflects improving short-to-medium-term momentum relative to the longer baseline.Because MACD is derived from moving averages, it is inherently a lagging confirmation tool: it usually turns after price has already started moving.
Many traders use it best in combination with structure (trendlines, swing highs/lows, and breakouts) rather than as a standalone trigger.
Important: MACD crossovers tend to be more reliable when they occur alongside a breakout from consolidation or after multiple “tests” of a level. In tight ranges, repeated crossovers can generate false starts, so waiting for price confirmation around key levels can materially change how the signal behaves.
What to Look For Before Acting
Do not assume the crossover guarantees a sustained uptrend. Consider these factors:
✅ A daily close holding above 1.228–1.229 (the current push zone) rather than an immediate fade
✅ Whether pullbacks respect former congestion around 1.2200–1.2220 as support
✅ A sequence of higher highs and higher lows on the daily swings (structure confirmation beyond the indicator)
✅ MACD histogram staying positive and expanding over the next several sessions (momentum follow-through)
✅ Check the 4-Hour or Weekly chart for alignment (trend consistency beyond the Daily signal)
✅ Whether volatility expands in the direction of the move (a common ingredient in more durable break attempts)
✅ Upcoming Australia/New Zealand data (inflation, jobs) or central-bank commentary that could inject event-driven volatility into AUD/NZD
Risk Considerations
⚠️ Whipsaw risk: AUD/NZD has shown range-like behavior at times, where MACD crossovers can quickly reverse
⚠️ Overhead resistance proximity: price is already pressing into a known reaction area (around 1.228–1.235), increasing rejection risk
⚠️ Lagging nature of MACD: part of the move may already be “spent” by the time the crossover triggers
⚠️ Event risk: scheduled macro releases can overwhelm technical signals and cause gaps or sharp reversals
Potential Next Steps
Add AUD/NZD to a watchlist and monitor.
Recent candles show price holding above the 1.2140-1.2190 support zone and pushing into a fresh short-term high near 1.2283.
Buyers are attempting to break price out of the recent sideways structure, but they still need a daily close above 1.2300 to confirm continuation.
Sellers need to reject the 1.2280-1.2300 area and force price back below 1.2130 to shift the structure into a deeper pullback.
No matter how you play it, keep position sizing in check and set a clear invalidation level before jumping in. MACD signals can flip fast if AUD/NZD slides back into chop mode.
Trade Idea: Bullish Continuation Scenario
Setup
The bullish setup is based on AUD/NZD holding the recent support zone at 1.2140-1.2190 and extending the broader daily uptrend.
Price is pressing into the current resistance area around 1.2280-1.2300, and a clean daily close above 1.2300 would suggest buyers are breaking out of the recent consolidation.
As long as price holds above 1.2140, the higher-low structure remains intact.
Entry
Consider a long on a daily close above 1.2300, confirming that buyers are breaking out of the recent structure.
Alternatively, enter on a controlled pullback into 1.2140-1.2190 if price stabilizes there and turns back higher.
If price loses that support zone and closes decisively below 1.2140, stand aside and wait for either deeper support to form or a cleaner breakout later.
Stop Loss
For breakout entries: stop on a daily close back below 1.2240. That would invalidate the breakout by showing price could not stay above the former ceiling.
For pullback entries: stop on a daily close below 1.2140. That would invalidate the support-hold idea and show buyers are no longer defending the zone.
Take Profit
The initial target could be 1.2400, since that’s the next clear upside area on the chart and a natural retest zone if the recovery keeps going.
More aggressive bulls could also consider trailing part of the position if price keeps making higher highs and higher lows, while moving invalidation higher as the trade works in their favor.
Bottom Line
The bullish case stays active if AUD/NZD can close above 1.2300 and hold that breakout. That would confirm buyers are extending the daily uptrend and opening the path toward 1.2400.
The key invalidation level is 1.2140. A daily close below 1.2140 would show the support zone has failed and would weaken the bullish continuation setup.
Trade Idea: Bearish Pullback Scenario
Setup
The bearish setup is based on AUD/NZD failing at the current resistance zone near 1.2280-1.2300 after an extended daily advance.
If buyers cannot sustain price above 1.2300, sellers may attempt to rotate price back toward the recent support zone at 1.2140-1.2190.
A daily close below 1.2130 would confirm that support has failed and increase the probability of a deeper pullback toward 1.2000.
Entry
Enter short on a daily close below 1.2130, confirming that the support zone has failed.
Alternatively, if price pushes into 1.2280-1.2300 and prints a clear bearish rejection candle, enter short on the next daily close back below 1.2240.
If price instead breaks and closes decisively above 1.2300, stand aside, as that would invalidate the bearish pullback idea.
Stop Loss
For breakdown entries: stop on a daily close back above 1.2190. That would invalidate the breakdown by showing price has reclaimed the support zone.
For rejection entries near resistance: stop on a daily close above 1.2300. That would invalidate the bearish idea by confirming buyers have pushed through resistance.
Take Profit
Initial target could be 1.2000, since that’s the next major support area below the current structure and a likely zone where buyers may try to step back in.
More aggressive bears could also consider trailing part of the position if price keeps making lower highs and lower lows, while moving invalidation lower as the trade works in their favor.
Bottom Line
The bearish case depends on AUD/NZD rejecting the 1.2280-1.2300 resistance zone and then losing 1.2140.
A confirmed daily close below 1.2130 would shift control toward sellers and open room for a pullback toward 1.2000.
If price closes decisively above 1.2300, the bearish pullback idea is invalidated. That would show buyers are still in control and that the market may be preparing to continue toward 1.2400.
This content is strictly for informational purposes only and does not constitute as investment advice. Trading any financial market involves risk. Please read our Risk Disclosure to make sure you understand the risks involved.


